Next, I define vertex weights(R) by the following formula:
cumulative contact rate with confirmed cases (R)
= the cumulative rate of confirmed cases *population density
= I/P * P/A
= I/A
I=the cumulative number of confirmed cases of the city
P=population of the city
A=area of the city(Km2)
R=the cumulative contact rate with confirmed cases of the city
The cumulative number if confirmed cases is according to the data from Taiwan Centers for Disease Control. [Fig.01]
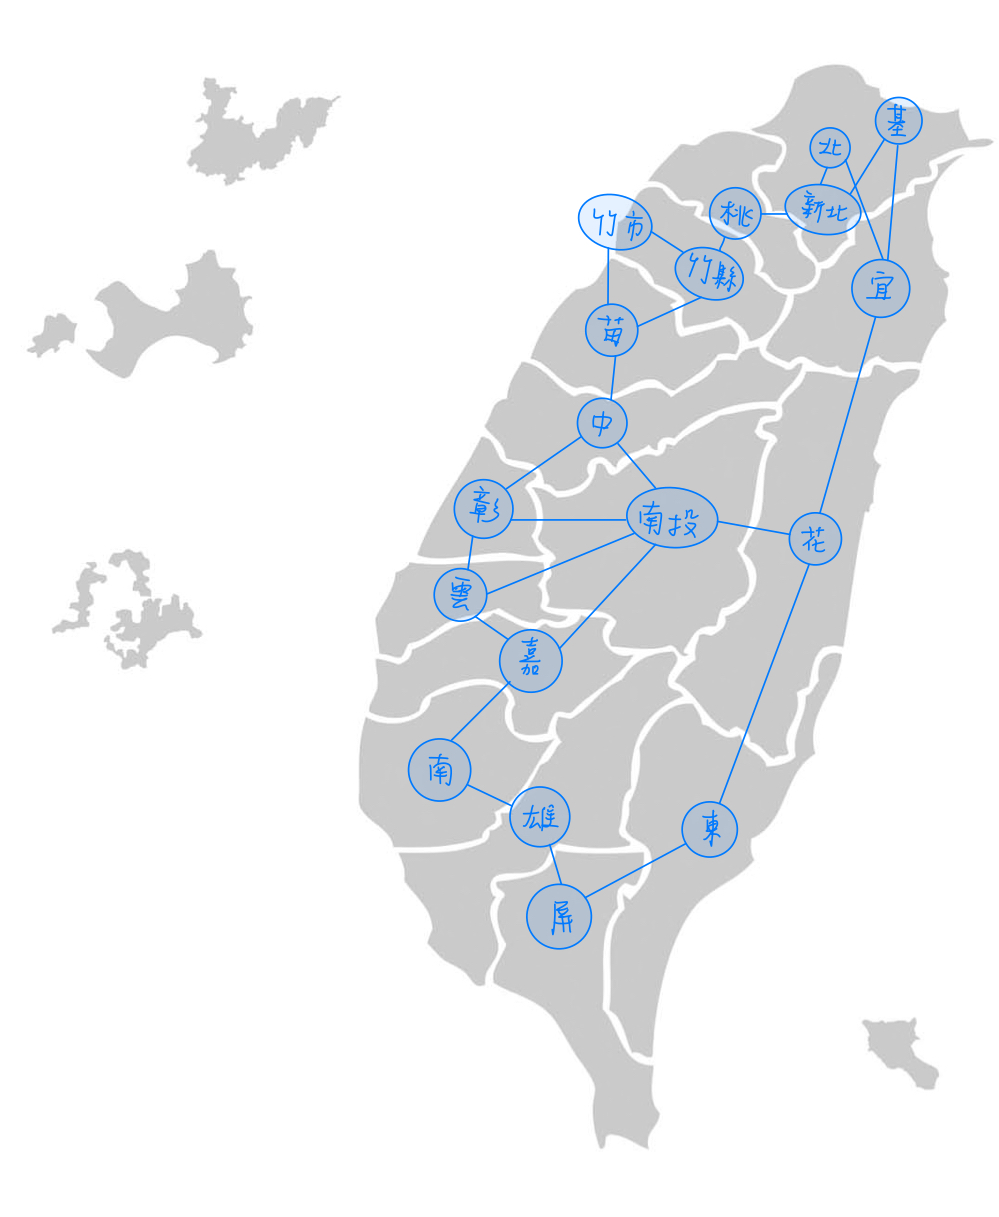
Now, we have a graph with weighted vertices and weighted edges[Fig.04(a)].
I would like to simplified the graph to apply single source shortest path (SSSP), so I made several assumptions to simplify this problem:
1. the boundary of two cities is right at their middle point.
2. the probability contacting people from different places is equivalent, and
the velocity of every person is equivalent
3. the population only moves in their own cities
Then, we can reweighted the edge weights (W') by the formula below:
W’(u,v)
=(R(u) * 0.1955 + R(v) * 0.8045)πd^2
d=distance between two cities (km)
R(u)=the cumulative contact rate with confirmed cases of the origin city
R(v)=the cumulative contact rate with confirmed cases of the destination city
W’(u,v)=the cumulative contact rate with confirmed cases on the path
[Fig.03] shows that W' differs when destination and origin are exchanged, so we transfer the graph into a directed graph as [Fig.04(b)]. All the W' are calculated in [Fig.05].
Finally, we can apply SSSP to this graph and find out the safest travel path for the given origin city. [Fig.02(b)] illustrates the safest path from Hsinchu to Taitong.